|
The Kolmogorov-Smirnov Test
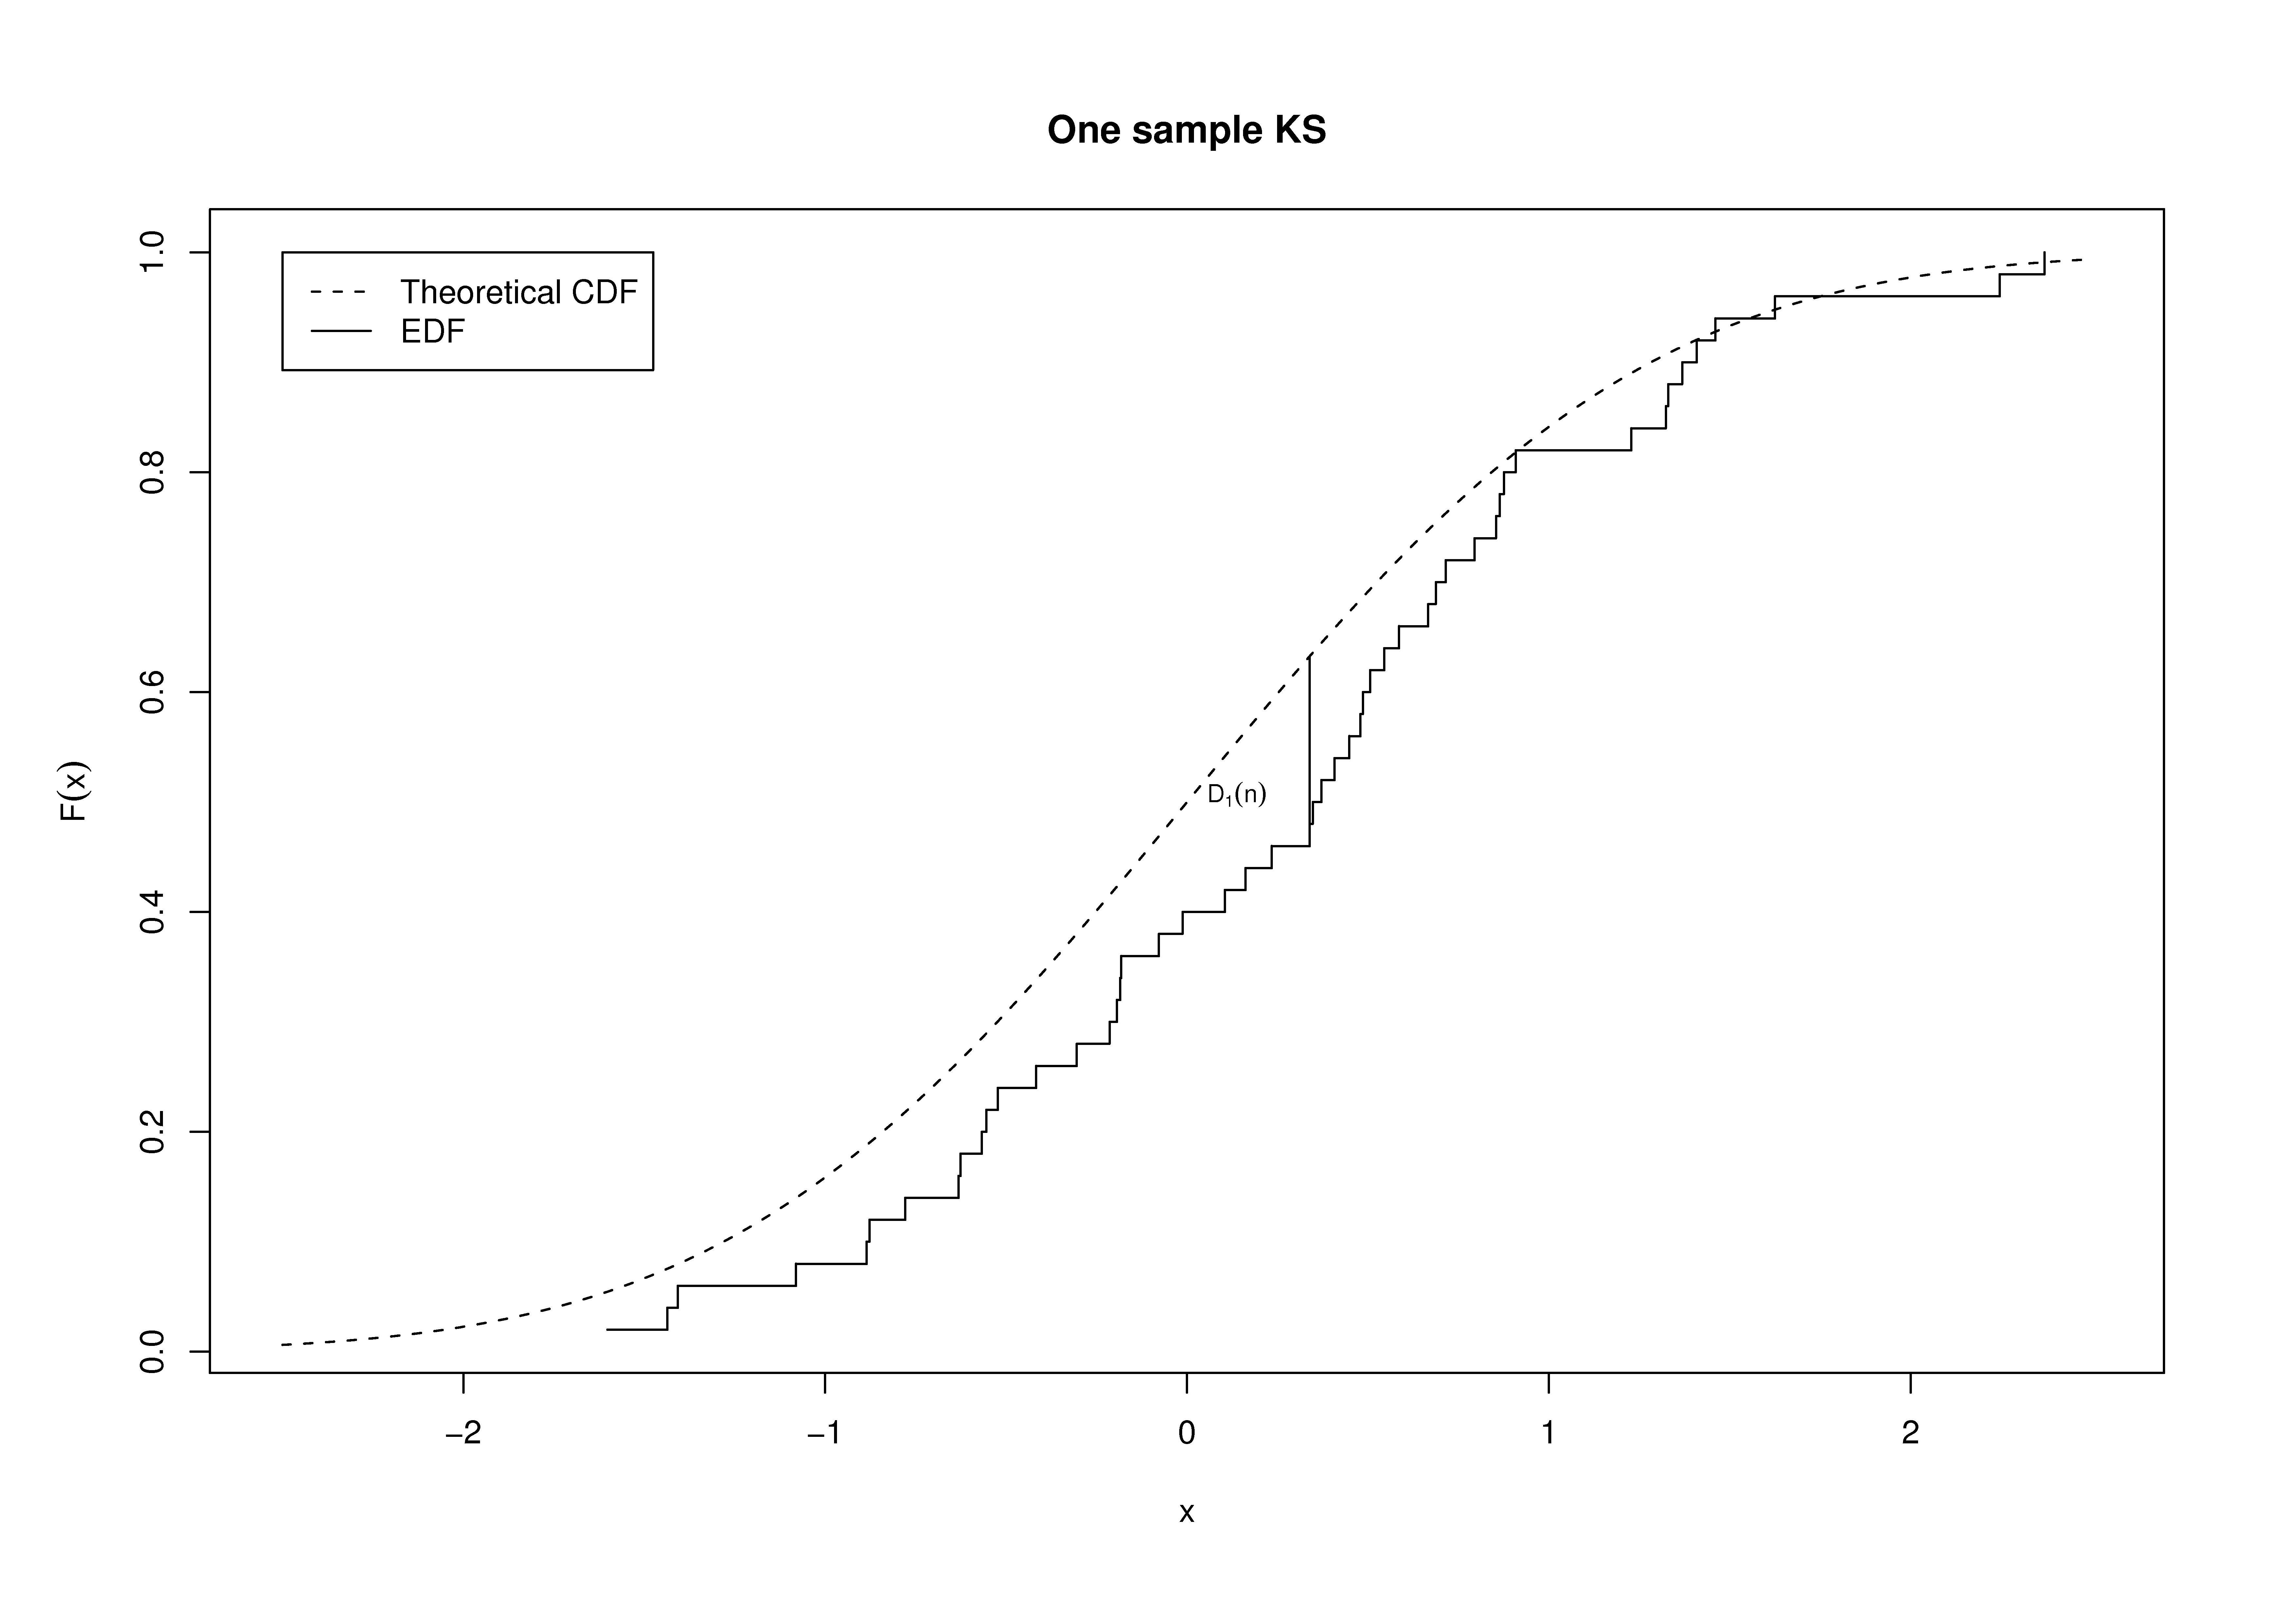
The one sample KS statistic compares a
hypothesized distribution F with the empirical distribution function
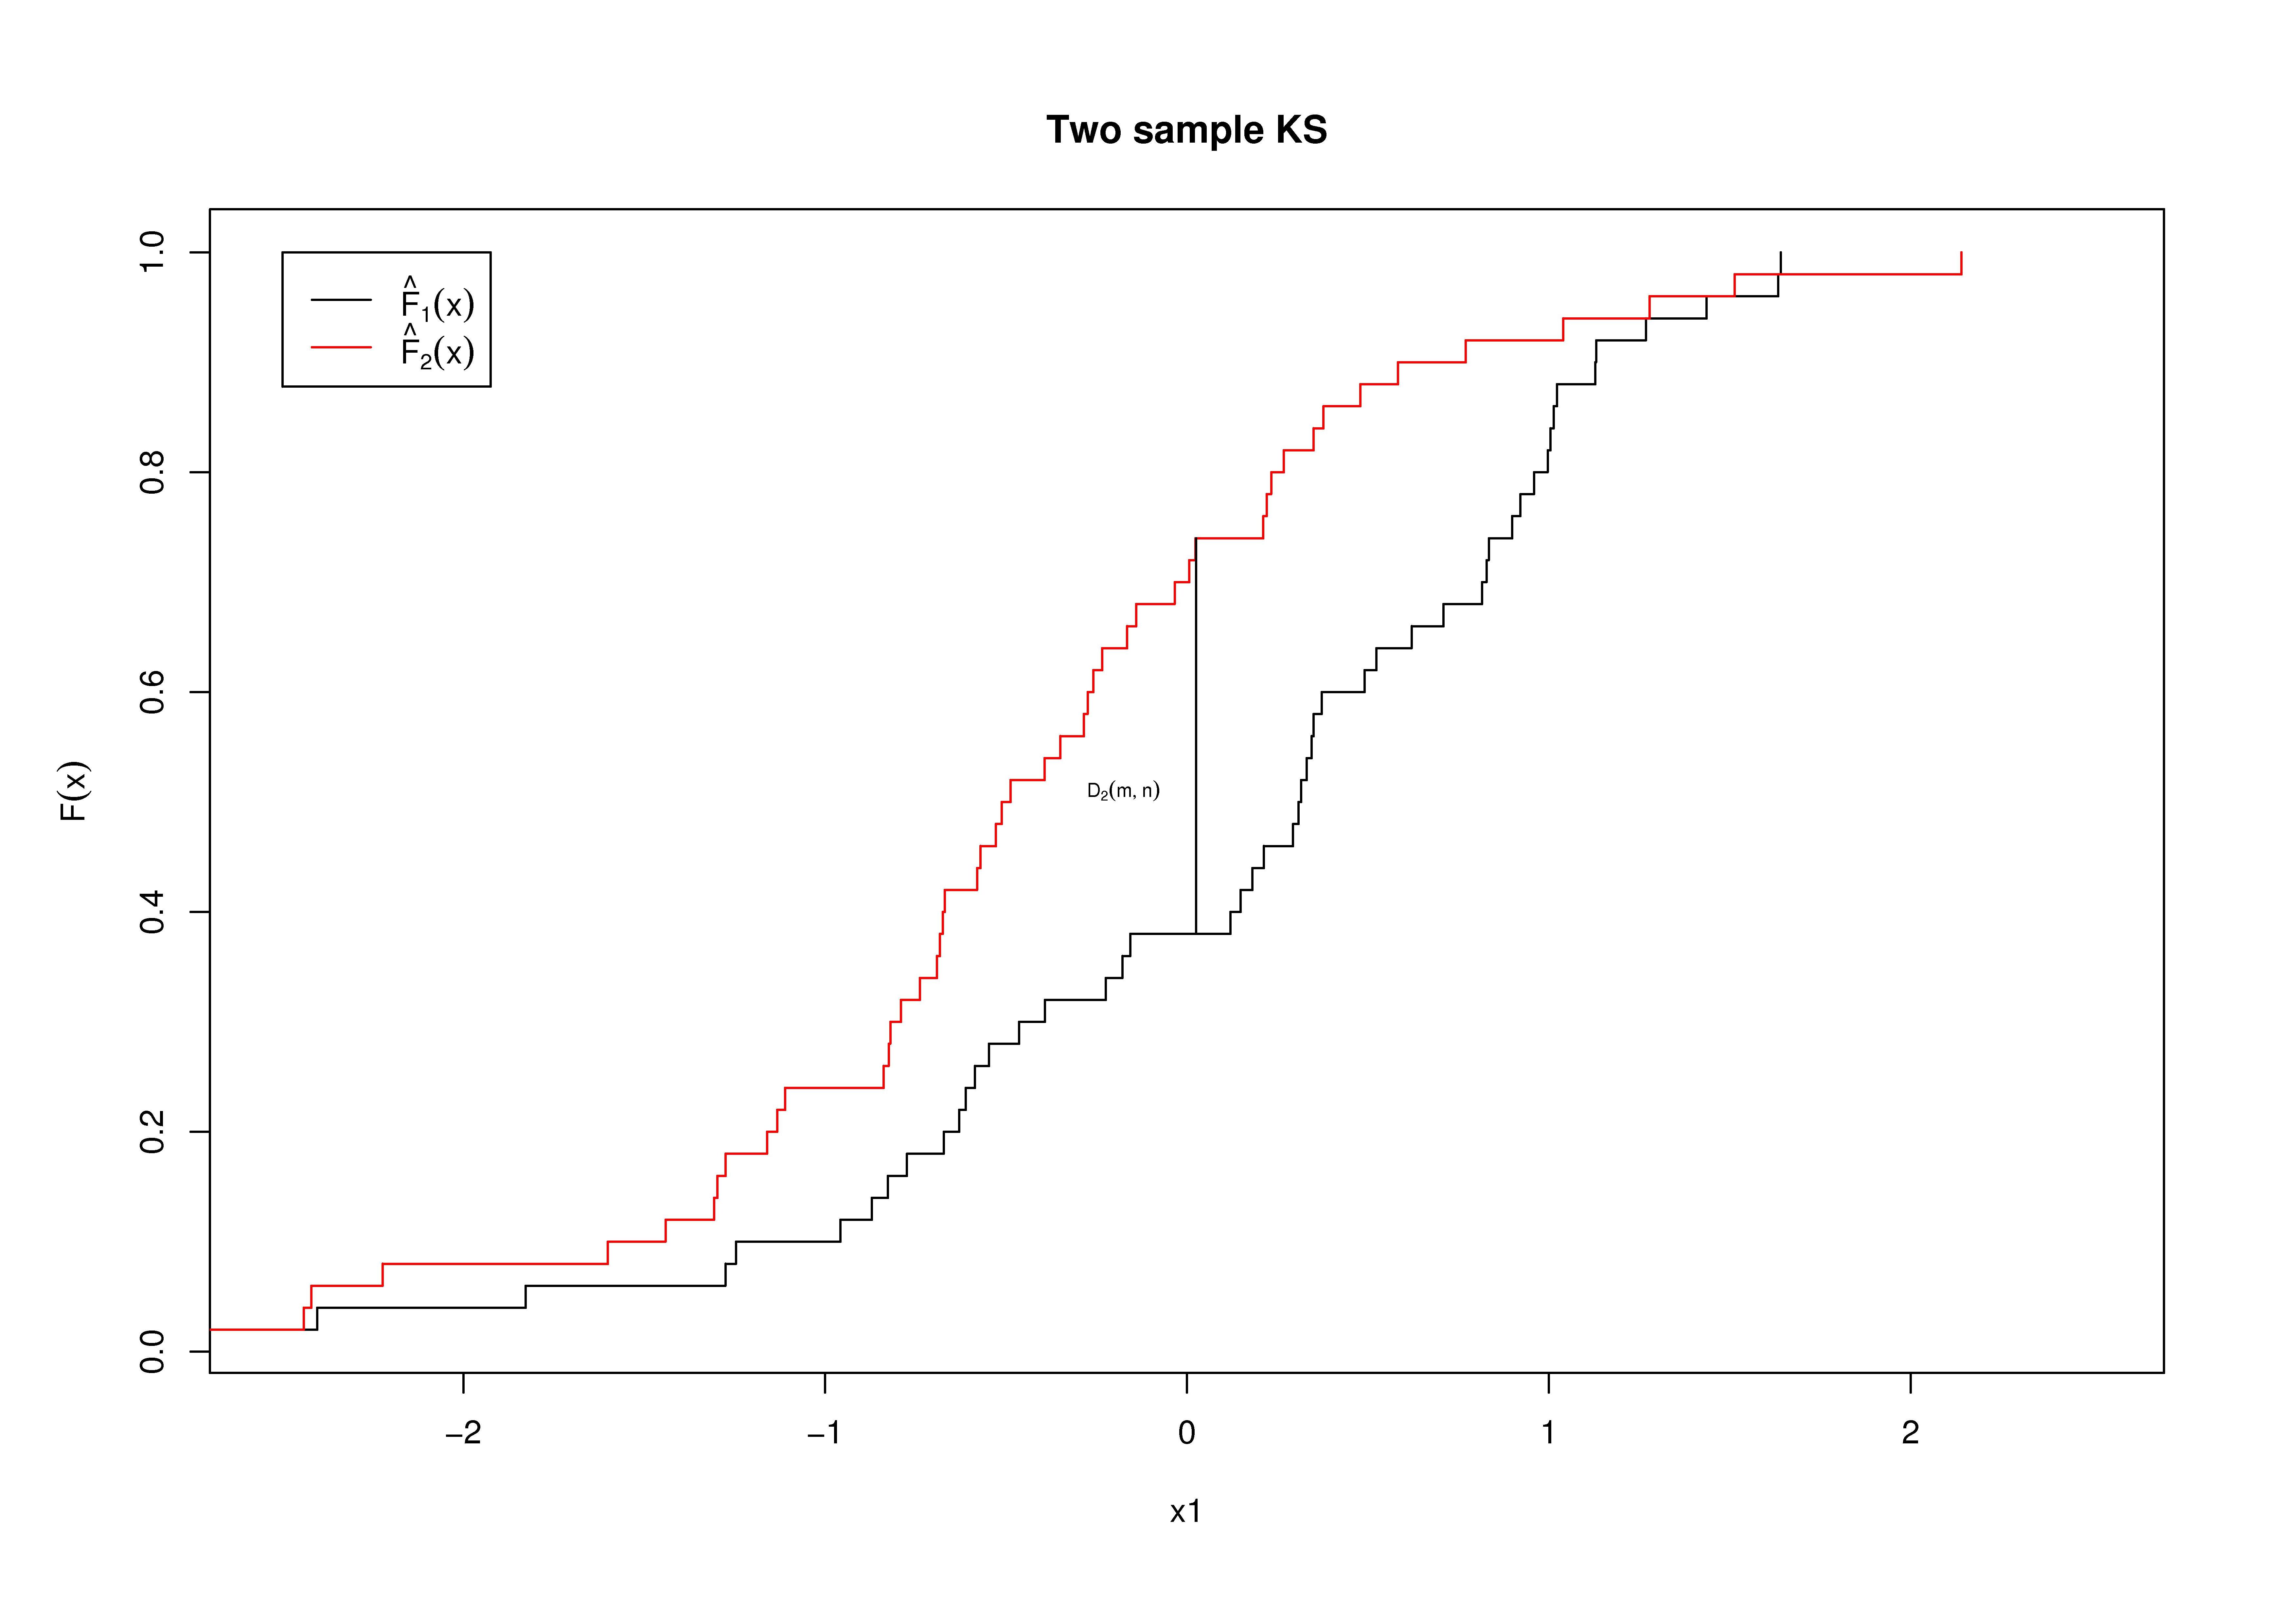
The two sample KS statistic compares two empirical distribution functions; the test statistic is D2(m,n) where
where
Here plots indicating graphically the how the two statistics are defined:
The magnitude of D1(n) or D2(m,n) indicates the truth of the relevant null hypothesis; the larger the statistic, the more likely that the two underlying distributions are not identical. The cut-off value determining how large the test statistic needs to be before the null hypothesis can be rejected is defined by involved probabilistic calculations that can be performed numerically. Conversely, the associated p-value (the hypothetical probability that a test statistic more extreme than the one observed could be obtained if the null model is in fact correct) for the test can also be computed. For the KS test, we reject the null hypothesis only if the p-value is smaller than a pre-specified value α=0.05 (or possibly α=0.01). A description and example is presented here (sourced from here).
|