|
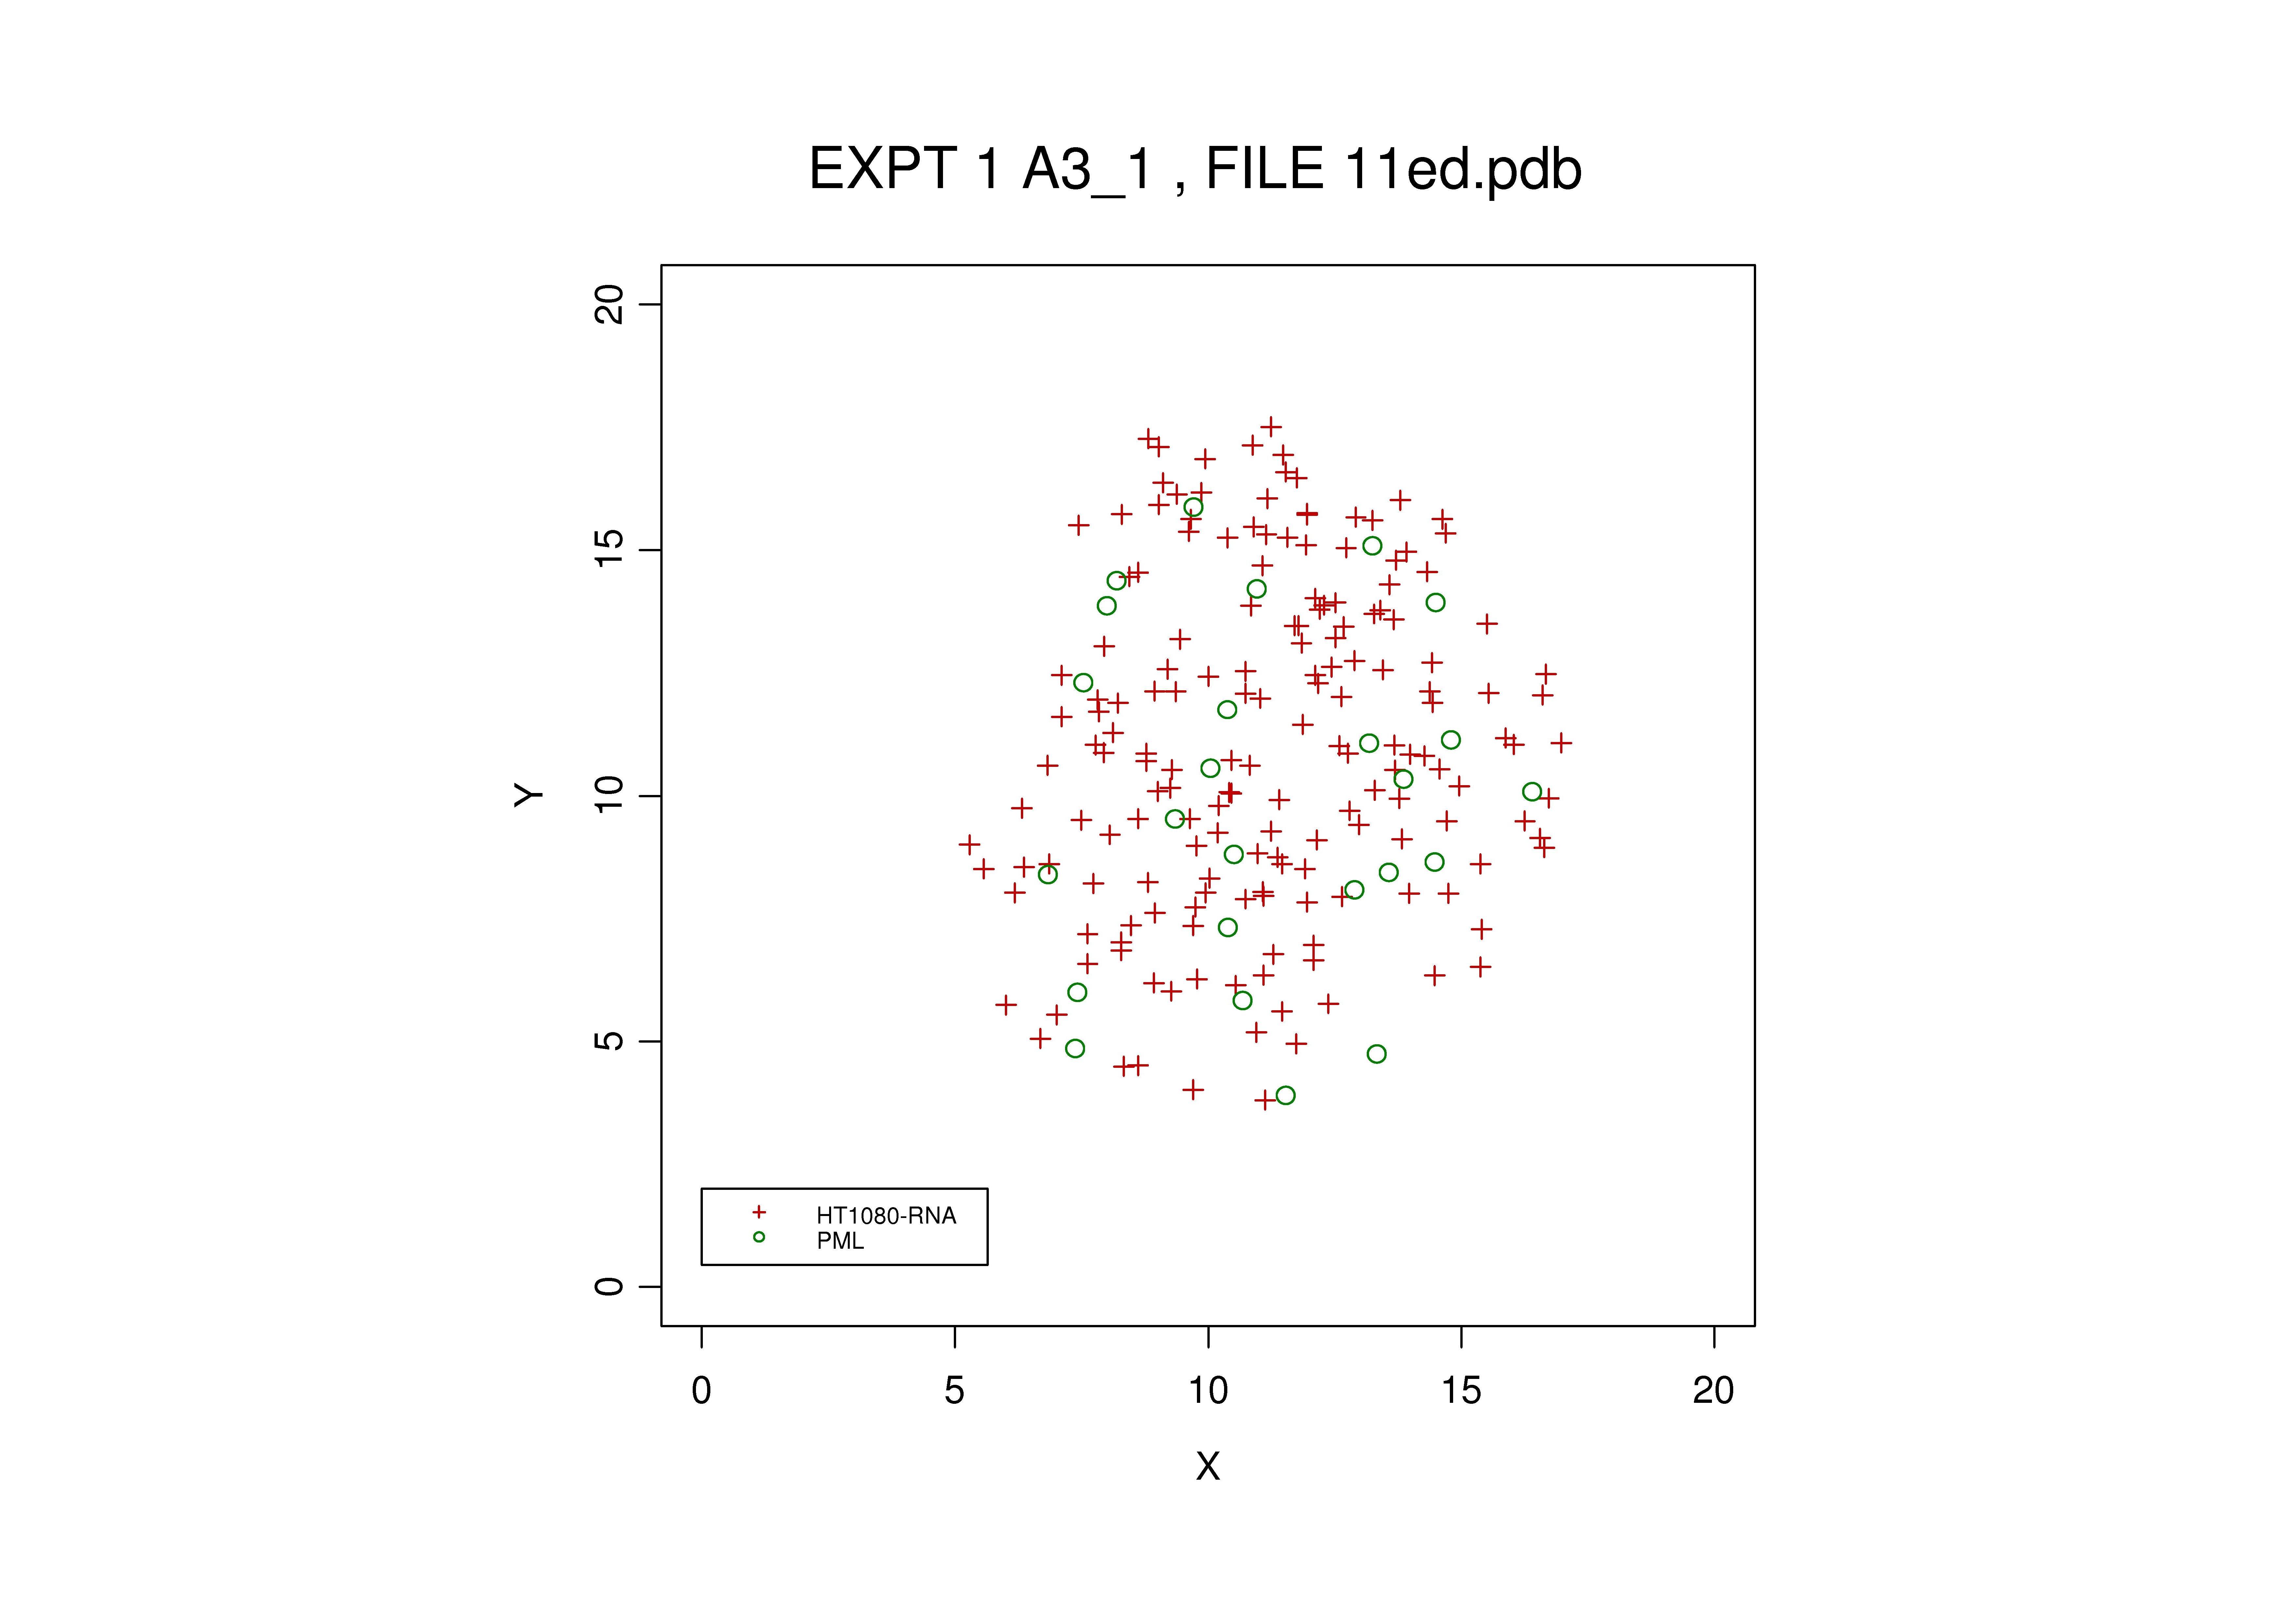
Point Pattern Data The data that are typically available are the spatial locations of the recorded objects, and a label denoting object type. The location data are recorded as triples (x,y,z), that is, coordinates in 3d space. The labels, l, take integer values {1,2,3,...}, where, say 1="PML", 2="RNA Polymerase II", 3-"Acetylated Histone" etc, so we might have a data file formatted as follows: x1,y1,z1,l1 x2,y2,z2,l2 x3,y3,z3,l3 and so on. Other information such as the volume of object observed at each location may also be available, but we ignore such information here. The extracted data can be displayed graphically as here or here. Here is a typical data file. The x,y,z coordinates are in columns 6,7 and 8.
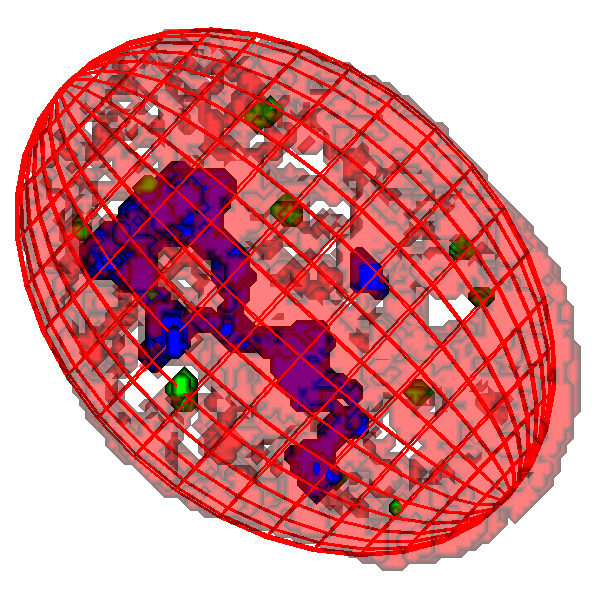
The coordinate system is typically arbitrary; scales may differ from image to image, and so aggregation of pattern data from different images must be carried out with great care. In biological reality, the points lie within the cell nucleus, and thus are spatially restricted. For some parts of the statistical analysis it is important to model this aspect explicitly, so a proxy for the cell nucleus, typically an ellipsoid, is also inferred from the image data (see below).
Fitted ellipsoid model of cell nucleus: PML foci coloured green
|