|
Autocorrelation
Autocorrelation is a measure of internal correlation within a time series. It is a way of measuring and explaining internal association between observations in a time series. For example, for the measles series you might ask "take an arbitrary spot in time, on the average what does the time series look like in four weeks time, compared to now?" In other words, you are asking a question about how strong is the internal association within the series at a period of four weeks. That association could be very strong and positive (i.e. the series in four weeks is similar to now), or be very strong and negative (i.e. the series in four weeks is very dissimilar to now) of there could be a weak or no relationship. Also, you might be interested in periods other than four weeks.
For example, you might be interested in periods of one week (and for measles, you might expect that the series does not change very much, so the association would be strong over periods of one week) or periods of 52 weeks, a year, and again you might expect a strong association as measles epidemics have a strong annual component.
Autocorrelation quantifies the internal association: assigning a value of +1 to perfect positive association, -1 to perfect negative association and zero to no association (note: autocorrelation measures linear association, in the same way that ordinary correlation between two variables does. So, sometimes autocorrelation can be zero for some kinds of nonlinear association).
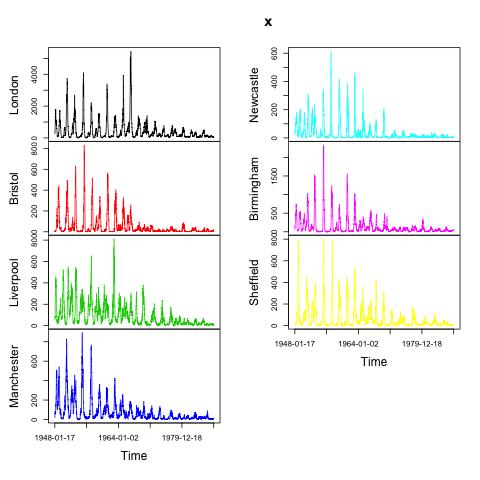
Measles Autocorrelation...
|
|