C++ code for Gaussian process clustering of multidimensional time series
Before downloading the software I have written, you should
read the copyright.
Code Download:
This is C++ code for all of the clustering methodology we developed on
my Wellcome Trust post doc. To
compile the code (instructions below), you will need to have a recent version of the GNU scientific
library installed. Windows users can download an executable for
installing the GSL here.
splinecluster.tar.gz (last updated October 2010) - Code for fitting Gaussian process models with spline basis functions
to multivariate time series. Compiling produces the executable
SplineCluster for performing clustering and then curve fitting for each cluster.
If you have problems compiling and are running Linux, Digital Unix,
Windows, Cygwin under Windows or Mac OS X, you may wish to try creating a
directory called splinecluster/ and simply copying in the correct static
executable instead:
<SplineCluster> (Linux 32-bit).
<SplineCluster> (Linux 64-bit).
<SplineCluster> (Mac OS Sierra 10.12.3).
<SplineCluster.dmg> (Mac OS X v10.7.5).
<SplineCluster.exe> (Windows)(OLD version).
<SplineCluster.exe> (Cygwin) (OLD version).
To Compile:
To unpack the files, enter the command
tar -xvzf splinecluster.tar.gz
To compile the C++ code, enter the splinecluster/ directory and type
make (or for Mac OS X, make -f makefile_macOSX)
Usage:
In general, the programs expect the data to be either in the column
vector format:
  subject 1 @ time 1
  subject 1 @ time 2
  	  .
	  .
  subject 1 @ time T
  subject 2 @ time 1
          .
          .

or the matrix format:

  subject 1 @ time 1   subject 1 @ time 2   . . .   subject 1 @ time T
  subject 2 @ time 1   subject 2 @ time 2   . . .   subject 2 @ time T
          .		       .	      .		    .
          .		       .	      .		    .
though in the latter case, it is important then to ensure that the shell
command contains the argument targetcolumns=1.
Output Files:
Suppose the final output clustering had C clusters. Under default settings certain files are generated, with the following filename endings.
- _clusters_.dat - Each row of this file corresponds to one gene. The first column is the output cluster number for that gene (a number between 1 and C), the remaining columns the expression time series for that gene.
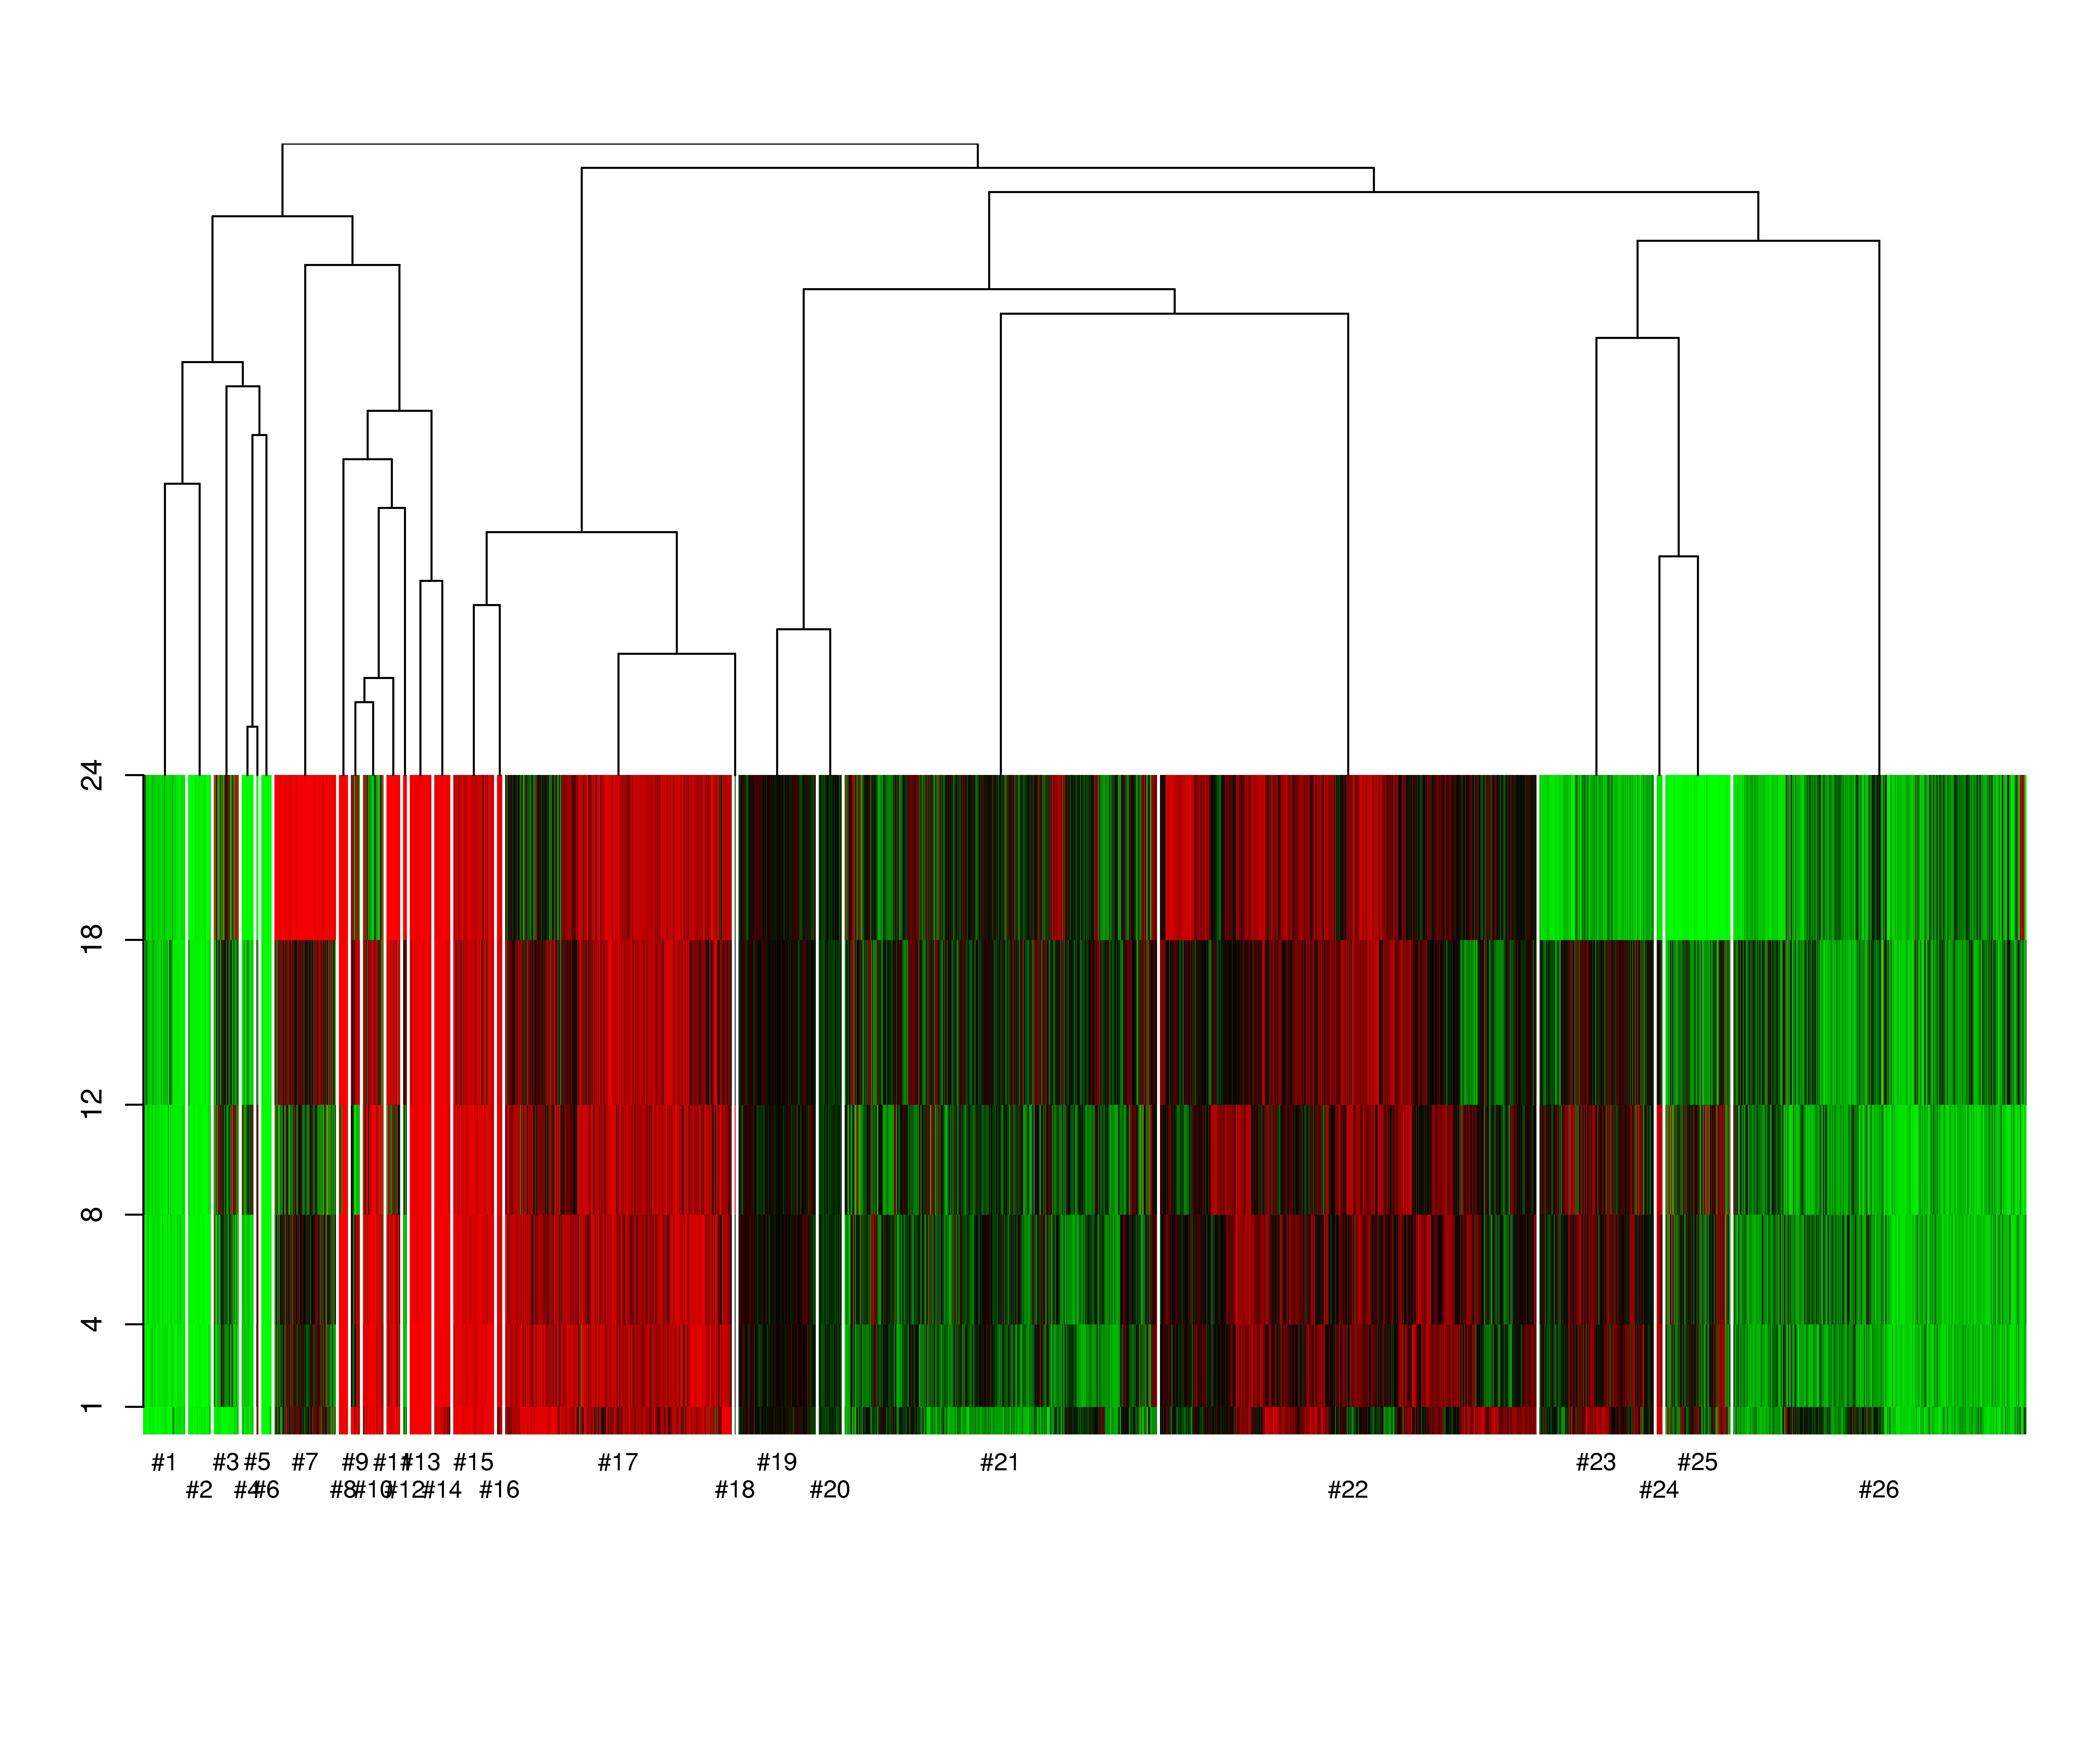
- _dendro_output_.dat - Gives an ordering of the genes as they should appear in a dendrogram for the hierarchical clustering. The gene numbers correspond to the order in which the gene data were input.
- _membership_probs_.dat - Each row corresponds to one gene (in the order in which the gene data were input). Each column gives the predictive probability of the gene belonging to each of the C clusters.
- _mergerdetails_.dat - A file to describe the order in which the agglomerative clustering process happened. In each row, the first column gives the number of clusters in the current model; the next four columns contain representative gene numbers of the two clusters which were merged in the previous agglomeration step (two for each cluster, representing extreme genes in some sense for each cluster). The penultimate column gives the log joint probability of the current model, and the final column gives an (unused) BIC score.
- _partition_.dat - row i of this file gives the cluster number to which gene i is assigned.
- _preds_.dat - used for making plots, this file has the lower credible interval, mean and upper credible interval curves for each cluster evaluated over a grid of points.
- _residuals_.dat - the residuals of the input data after subtracting the fitted curve values.
Single Experiment Example Data Set and Shell Script:
ecoli.tar.gz - An example data set, a
subset of which was used for analysis in Genome expression analysis
of Anopheles gambiae: Responses to injury, bacterial challenge, and
malaria infection (Dimpoloulos et al, PNAS, 2002) and can be found
in supplementary data tables at
http://www.pnas.org/cgi/content/full/092274999/DC1.
The tar file also contains a shell script for running the code in
splinecluster/ and generating output files for viewing using R. The data set
contains a measurement of relative gene expression under the first of two experimental
conditions for each of 2596 genes, taken at 6 identical, unequally spaced time points - 1hr,
4hrs, 8hrs, 12hrs, 18hrs and 24hrs.
To Run:
To unpack the test data set, enter the command
tar -xvzf ecoli.tar.gz
Then, after going into the ecoli/ directory, entering
./ecoli_shell
will run a shell script to perform hierarchical clustering on the
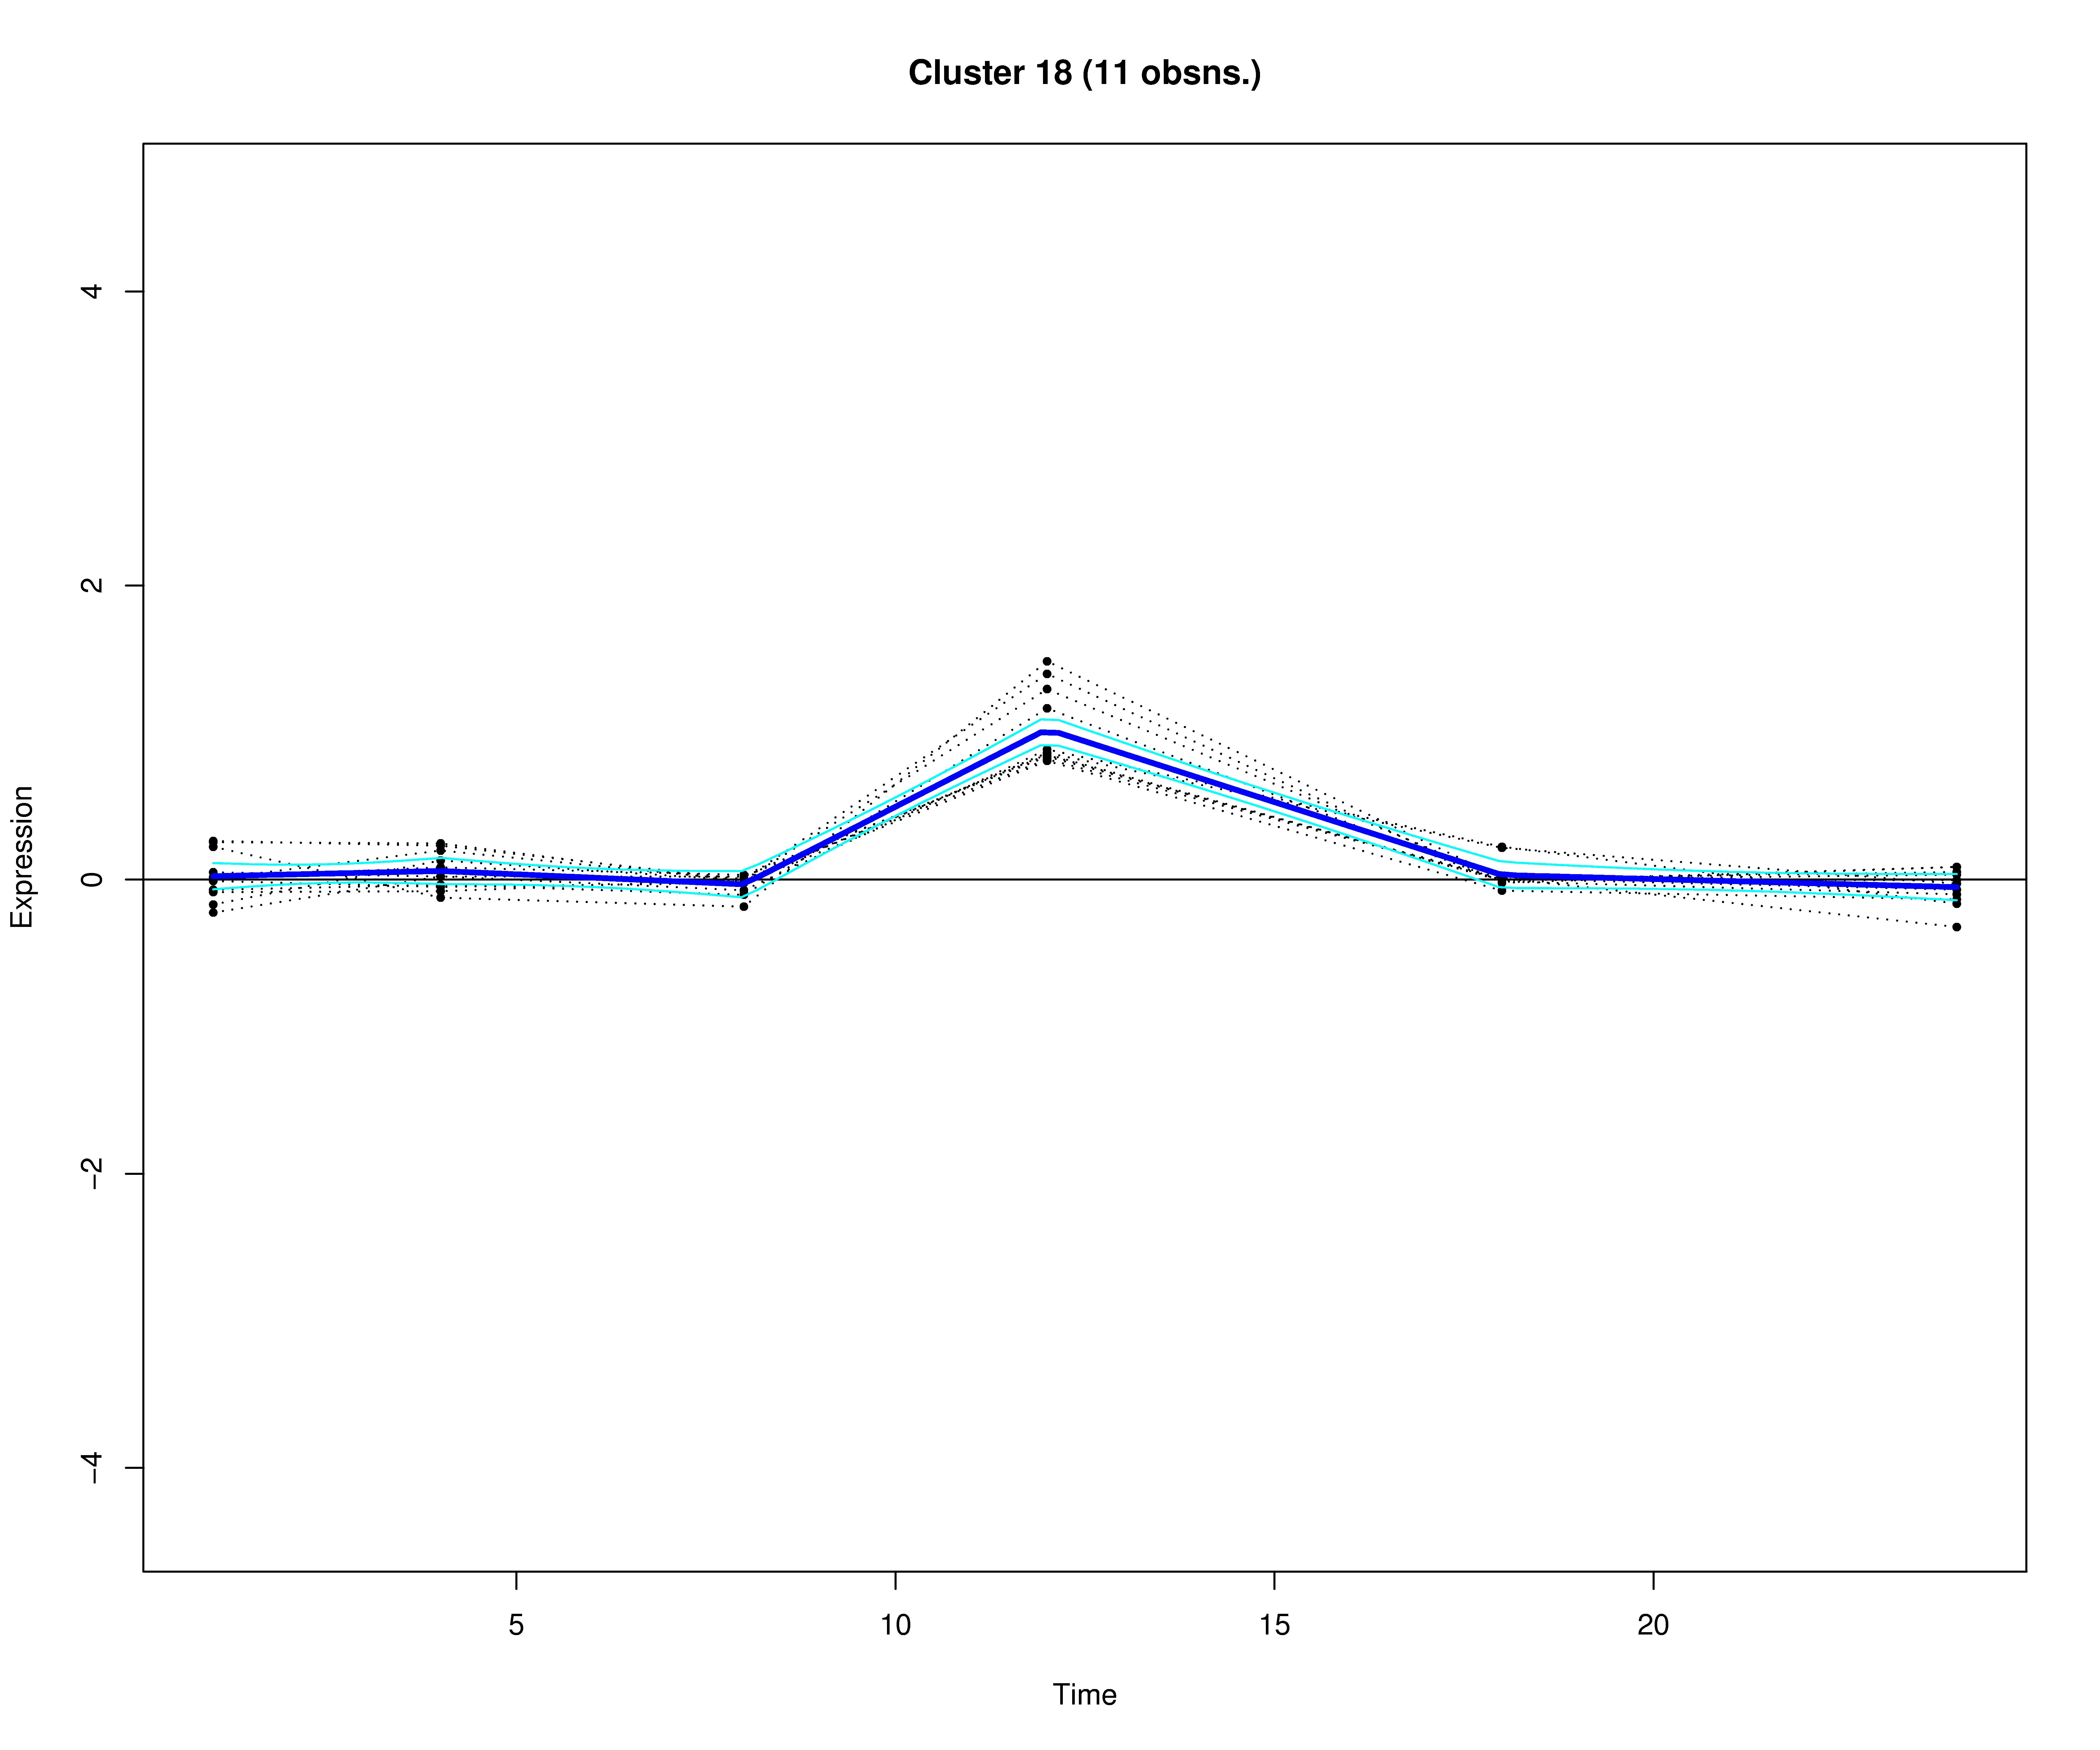
E. coli data set provided. This script will also produce an
output file of cluster images, such as the ones below, in
ecoli_preds.pdf. The figures are created using the statistical
package R.
Multiple Experiment Example Data Set and Shell Script:
simulated_multiple_experiment_data.tar.gz - A toy simulated data set, where expression levels are
recorded across 6 experiments with varying time points. A shell script
and R script for running the code and producing output figures are
also provided. The extra command datablocksizes= in the shell script
tells the code how many time points each experiment series has.
To Run:
To unpack the test data set, enter the command
tar -xvzf simulated_multiple_experiment_data.tar.gz
Then, after going into the simulated_multiple_experiment_data/ directory, entering
./simulated_shell
will run a shell script to perform hierarchical clustering on the
simulated multiple experiment data set. This script will also produce an
output file of cluster images using the statistical
package R.
Example Output Figures:
This software is still being updated.
Return to the homepage.