A zip archive of the code can be downloaded HERE.
I addition we maintain a public git repository of the code. The most up-to-date code will always be available via this repository on github and the associated homepage.
- https://github.com/michaelschaub/PartitionStability -- git repository
- http://michaelschaub.github.com/PartitionStability/ -- associated code homepage
Please feel free to send an email with any suggestions, questions etc. regarding the code or make use of the repository to contribute.
Make sure you have a C++ compiler installed
- For Linux, you can find one here: http://www.gnu.org/software/gcc
- For Windows, you can use Visual C++ express: http://www.microsoft.com/express/Windows
Make sure mex is properly configured in Matlab: Type "mex -setup" in Matlab, and choose your compiler.
Run "Install_Stability" in Matlab -- if you get an error message concerning the libstdc++.so file, you may want to try the following manipulation:
    cd "Matlab_root_directory"/sys/os/glnx86/
    sudo mv libgcc_s.so.1 libgcc_s.so.1.back
    sudo mv libstdc++.so.6 libstdc++.so.6.back
Type "help stability" in Matlab to discover how to use the code.
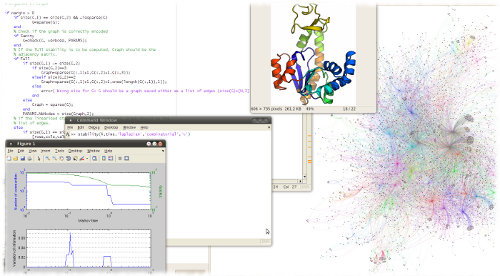
Try this example to check that everything is working:
    cd('demo');
    load demo;
    [S, N, VI, C] = stability(Graph,Time,'plot','v');
NOTES:
The install script adds the bin folder to your Matlab path. This will enable you to use stability as a standard Matlab function form everywhere. If you don't want that, just remove it from the path by going in File/Set Path.
If you get a warning message concerning savepath, and you want the stability code to be in your path, go, after the installation, in File/Set Path, and choose "save". Then choose where you want pathdef.m to be saved. If at the next matlab startup, you notice that stability is not in your matlab path anymore, try editing/creating the "startup.m" file from your matlab user folder (type userpath to know where it is located) and add the following line: addpath(' path to bin folder of stability package ').
If you want to speed up the calculations, you might consider adding the option 'noVI', when computing the stability. This will disable the calculation of the variation of information, which is usually slow at small Markov times, when the number of communities found is big. Another option is to decrease the number of optimisations on which the variation of information is calculated. To do so, add the option 'M' and put a value such that M < L (L is the number of louvain optimisations).
Example:[S, N, VI, C] = stability(Graph,time,'plot','v', 'L', 100, 'M', 10);